")
")
Data
Data Fields
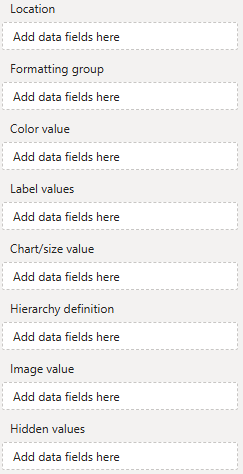 Location - Used to reference geographic element (shape, point or route). To reference shapes use aivalable mapping attributes (e.g., a country's ISO code), for points and routes use geo-coordinates.
Formatting group - Use this categorical field as identifier to set (formatting group based) colors and formatting.
Color value - Use to conditionally color shapes, points and routes.
Label values - One or multiple measures to be show as shape, point or route labels on the map.
Chart/size value - Assign a measure to this field for value based sizing of minicharts or line weights.
Hierarchy definition - Custom shape hierarchies can be defined here.
Image value - Assign images to be displayed on the map (as markers or charts) here.
Hidden values - Assign additional measures (used for sorting or in tooltips) here.
Assign at least a location field. An orthographic projection of the Earth will appear, and the formatting area will be populated with the visual's formatting options.
![]()
Location
The location field is essential, because it is used to reference areas, points, or lines on the map. Areas are referenced using mapping attributes, while points and lines are defined by their geographic coordinates.
Mapping areas using mapping attributes
Areas are referenced using so-called mapping attributes. Each area of a map has a set of mapping attributes you can use. For example, on the default world map the United States of America can be referenced using either one of these attributes:

Use a data field containing country names, ISO codes (numerical three-digit or alphabetical two- or three-digit) to reference a single country, continent names, names of regions (United Nations grouping or World Bank grouping), or names of sub-regions to reference a group of countries. By assigning multiple data fields each referencing a different mapping attribute on a different drill level (e.g., continent and country), you can create a hierarchy, users can use to drill down. You can even define your own hierarchies.
To get an overview of available mapping attributes, assign any data to the "Location" field and toggle "Mapping info for unmapped areas" in the map formatting options.

This will display the mapping information for all areas of the map that could not be mapped using the provided "Location" data.

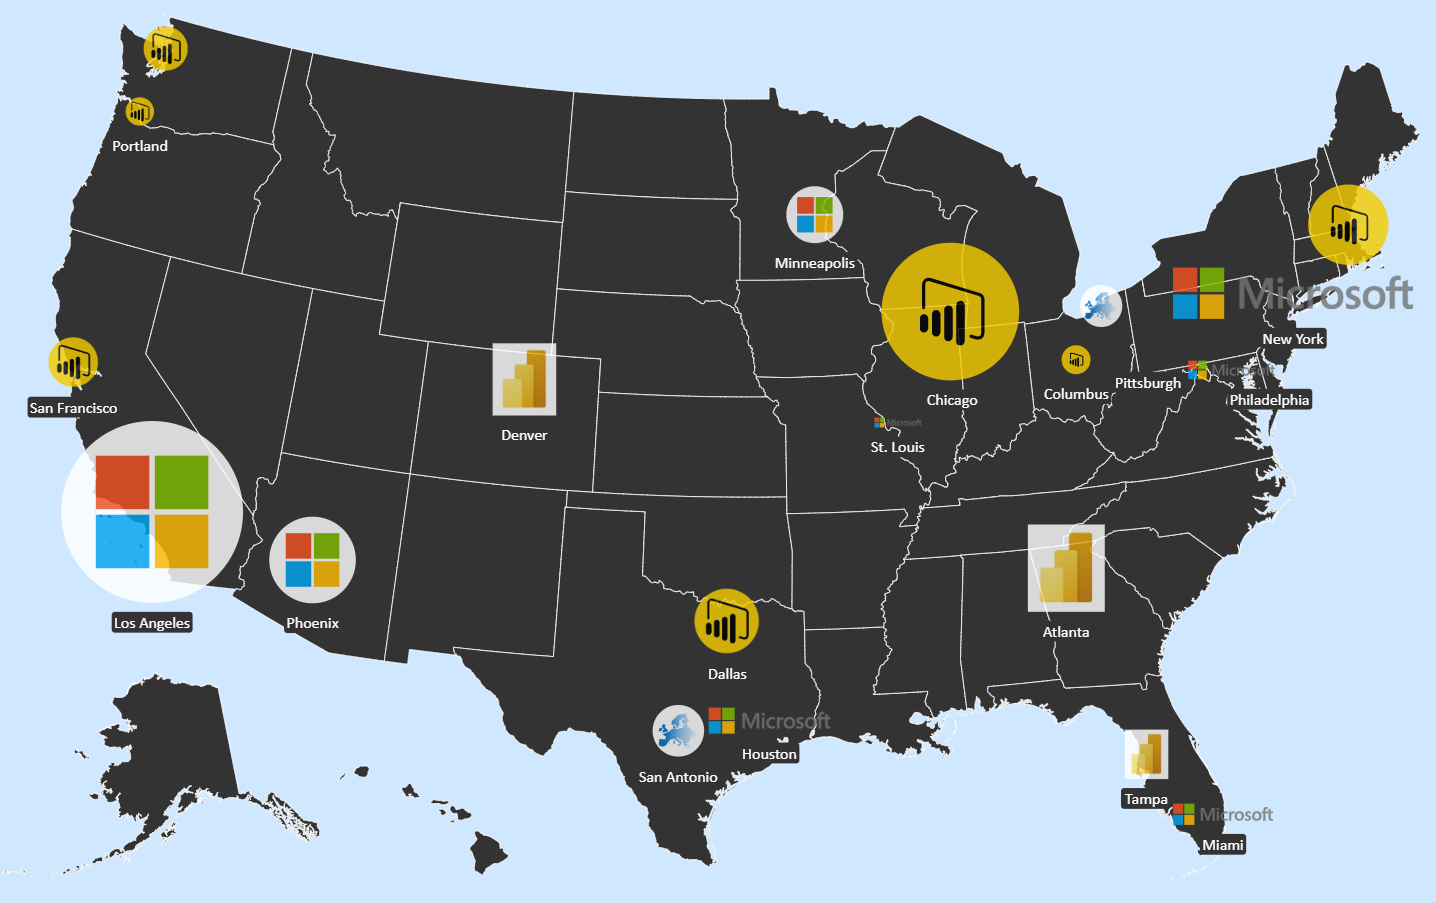
Projecting points by their geo coordinates
To project points on a map (e.g., cities or your company's locations), provide the point's geographic coordinates in the form [latitude|longitude]. For example, to display Berlin, Germany, on the map, use the measure value [52.52|13.40], and for New York City, use [40.75|-73.98].

Projecting lines/routes using their defining geo points
Similar to how points are projected on a map, you can also draw lines by defining their start and end points in the form of [latitude|longitude] [latitude|longitude]. For example, to draw a line from Berlin to New York City, you would use the measure value "[52.52|13.40] [40.75|-73.98]". Note that line definitions are not limited to just two coordinates, allowing you to visualize multiple connected lines (e.g., multi-stop routes).

Formatting group
The formatting group can be used to categorize locations and assign them a specific (group) color or other formatting (e.g., label or point marker formatting). For example, you could assign a color to your company's customer locations to represent their customer status. Group colors can be applied to areas, points and lines. Group individual formattings are available for labels and point markers.
Here is an example. The countries are colored by formatting group "continent":

Color value
With the "Color value" measure, you can implement value-based coloration for specific map elements, i.e. areas/shapes and routes/lines. Once a color value is assigned, users can enable coloration by color value and define colors and color scales in the visual's formatting area.
Here is an example. The countries are colored by their population:

Label values
To display labels on areas/shapes, points, or lines, use the "Label values" data field. Labels can be numeric (e.g., sales for that location) or textual (e.g., the name of the location). To show multiple labels, simply assign multiple measures. They will be displayed line by line in the order in which they are assigned.

Chart/size value
For minicharts (columns or circles) on areas or points, or for conditional sizing of lines/routes, use the "Chart/Size value" measure.
Here is an example where the circle sizes represent the populations of the cities:

Hierarchy definition
As explained in the "Location" section, users can drill down along predefined hierarchies if multiple fields are assigned, each containing matching mapping attribute references (e.g., continent "North America" on level 1 and country "US" on level 2).
With the "Hierarchy definition" measure, you can define additional groups to create your own two-level drill hierarchy. To create a group, the "Hierarchy definition" measure must contain, for each "Location" value, a list of areas/shapes (with matching mapping attributes) that the group consists of, separated by "|". For example, to define a custom group NAFTA, the measure value for that group would be US|CA|MX.
Here is an example of a hierarchy definition.
Before drill:

After drill on Southern Europe:

Image value
Use this field for images to be displayed on the map as markers or minicharts.
Hidden values
Use this field for additional measures you need for sorting or measures to show exclusively in tooltips.