")
")
 Maps Lite
Maps Lite
Maps Lite is a focused and flexible custom visual for Power BI that enables rich geographic data visualization using your own GeoJSON or TopoJSON maps. Whether you're analyzing sales territories, visualizing custom regions, or working with floorplans and district boundaries, Maps Lite delivers interactive, visually engaging insights based entirely on your custom shapes.
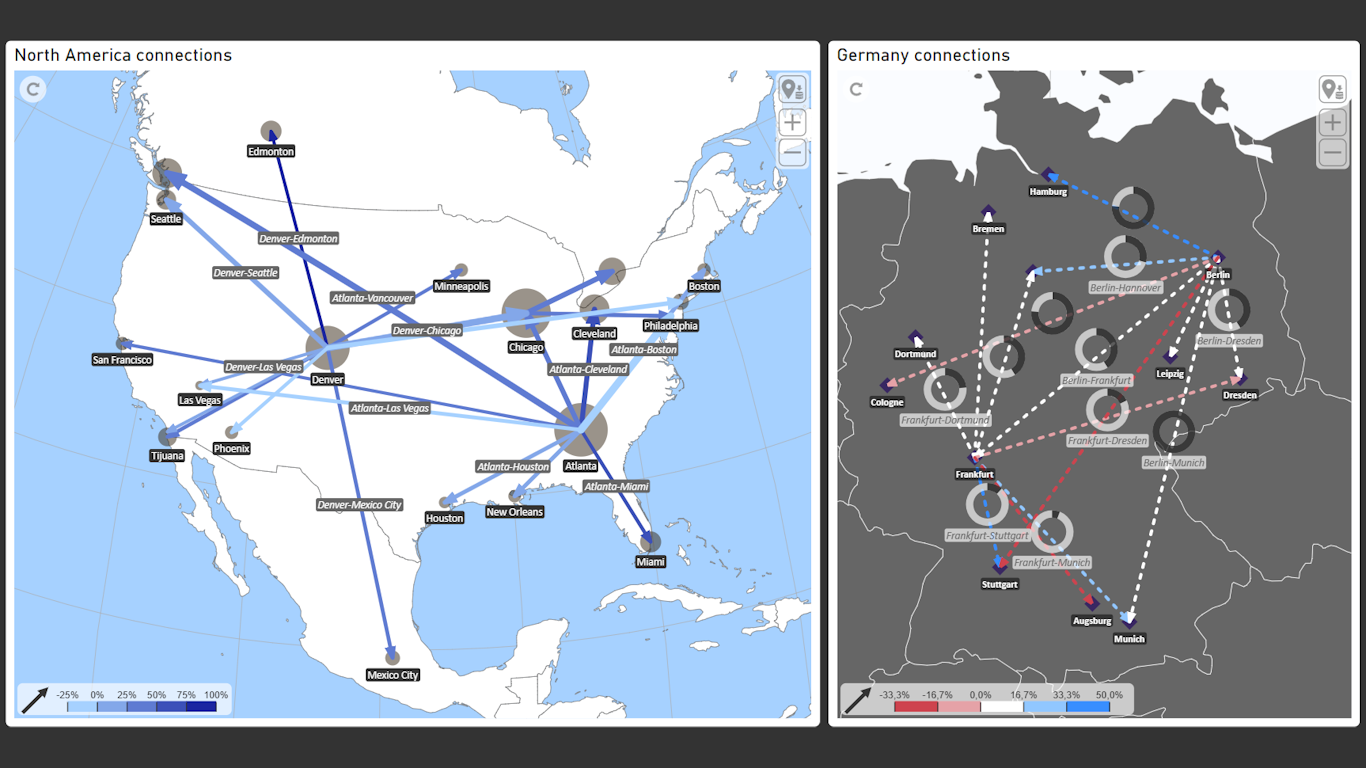
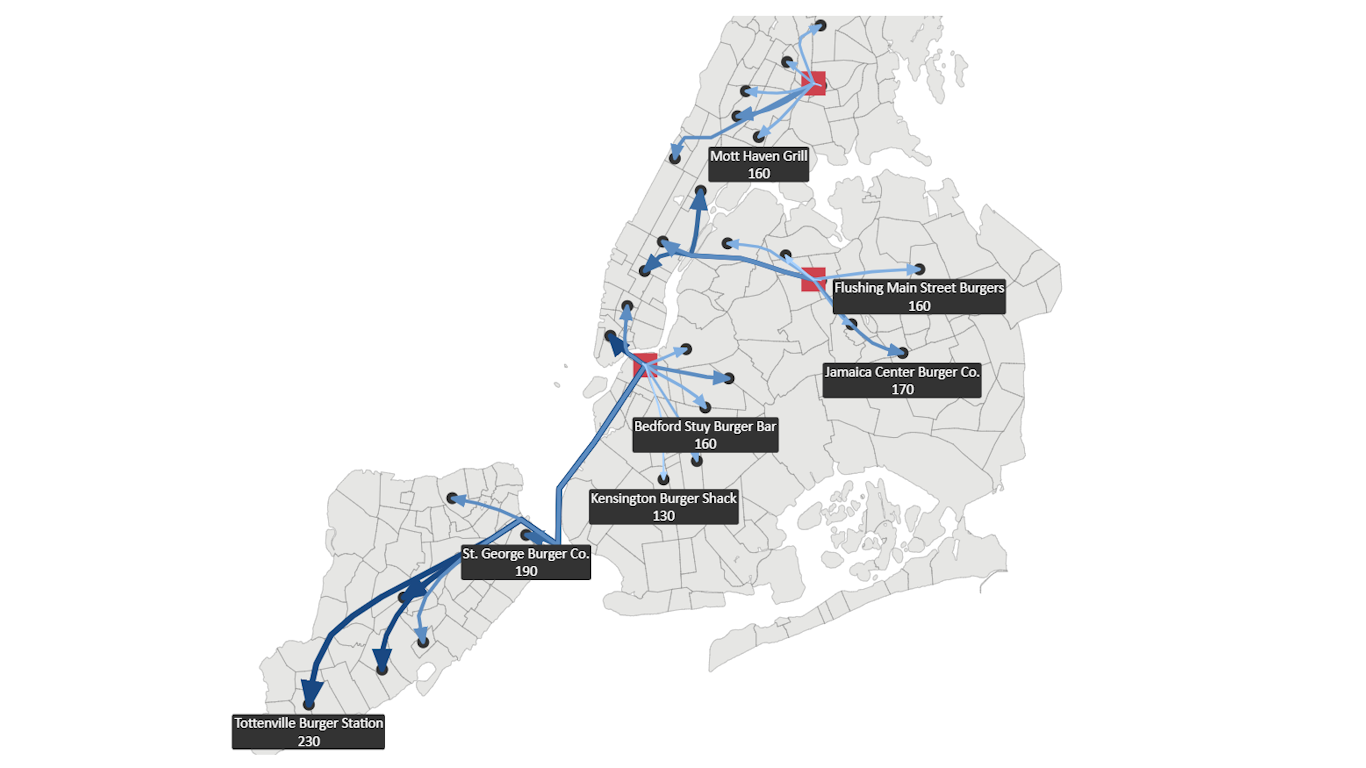
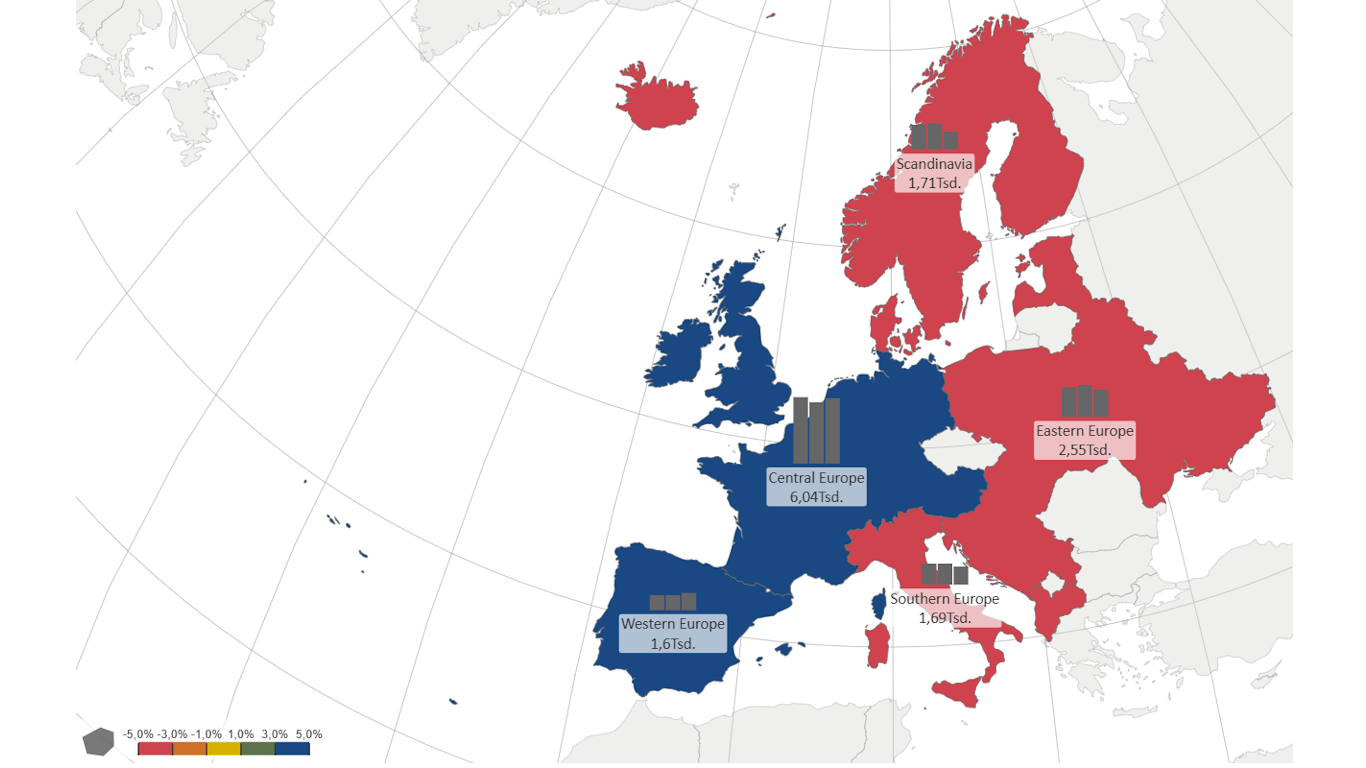
Choose from multiple visualization styles including choropleth (area coloring), point markers, mini charts, labeled routes, and geo‑coordinate‑based connections. Each map element—area, point, or line—can be individually formatted and selected to present KPIs with precision and clarity.
Maps Lite supports intuitive interactions like zooming, panning, rotating, and drilling, with features like auto‑centering and extensive formatting options to enhance usability. Designed for environments where custom geography is essential, Maps Lite is your streamlined solution for shape‑based geospatial storytelling in Power BI.


Further information
