


 Maps
Maps 
Maps
Maps is a powerful and versatile custom visual for Power BI designed to bring modern, multi‑layer geographic analytics into a single, unified experience. It builds on familiar mapping concepts while introducing advanced capabilities that help you visualize complex spatial data with clarity and precision.
Why another map visual?
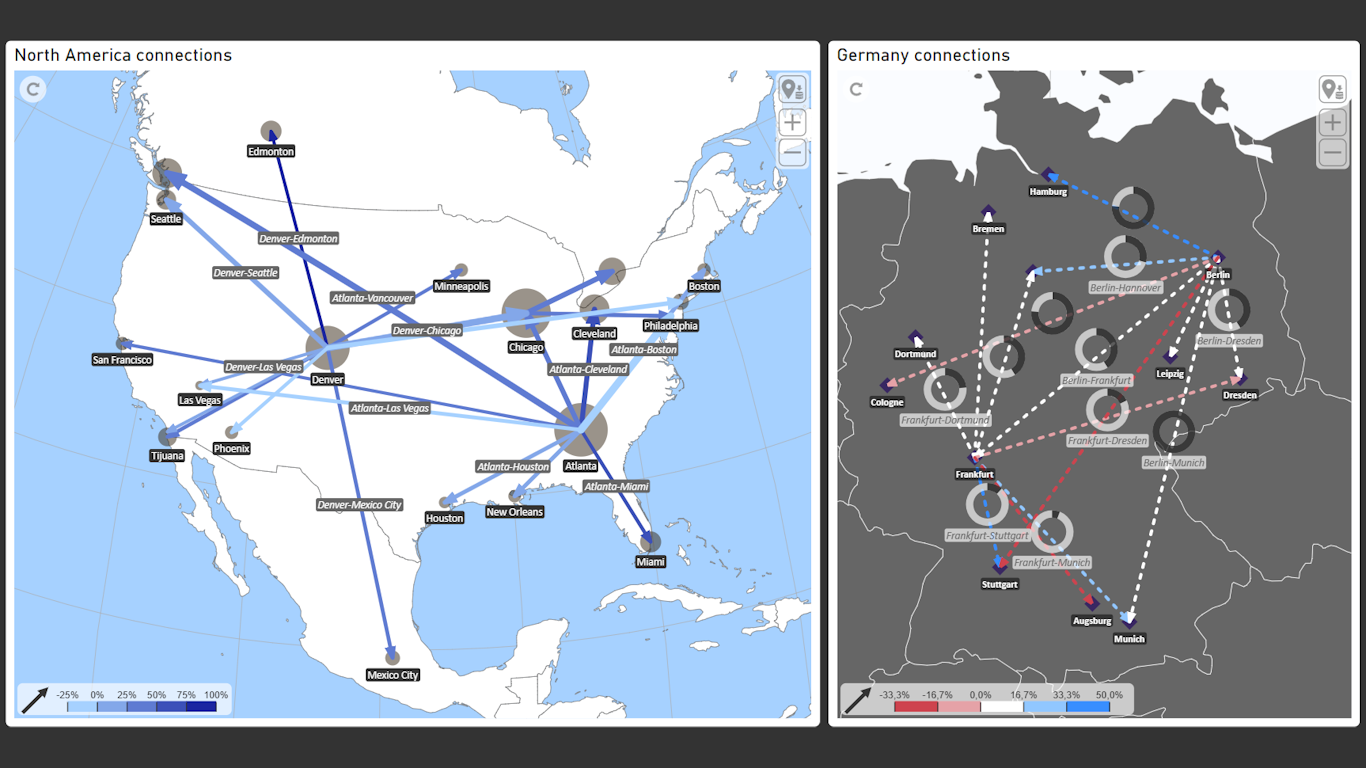
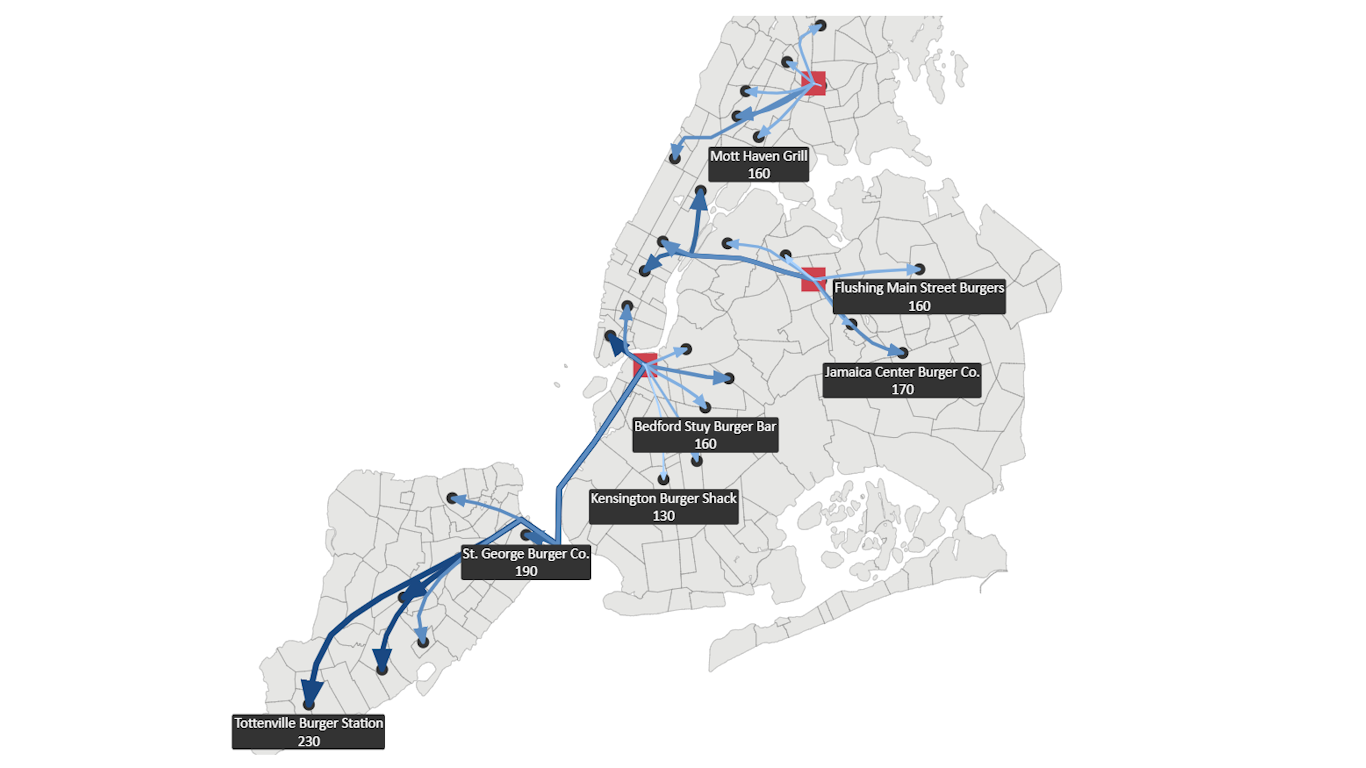
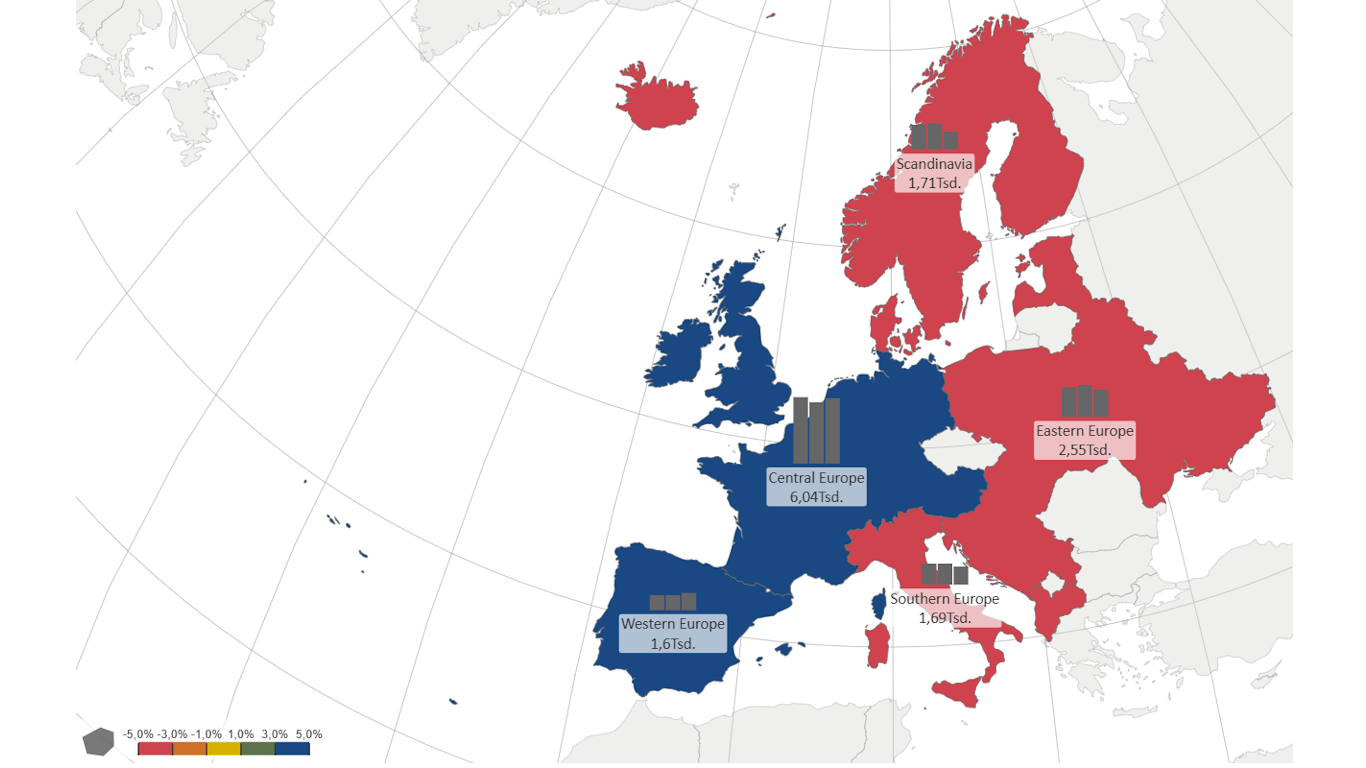
Maps extends Power BI’s built‑in mapping options by combining the strengths of the built‑in Shape Map and Azure Maps visuals while addressing their core limitations. It provides a flexible geo‑visualization engine that supports multi‑layer mapping (areas, points, and routes), measure‑driven markers and images, mini‑charts directly on the map, animated flows, and custom drill‑down hierarchies — all without relying on external map services.
Maps enables rich geographic data visualization using over 200 built‑in global and regional maps. Whether you're analyzing sales by region, tracking logistics, or comparing market performance, Maps delivers interactive, visually engaging insights.
Choose from multiple visualization styles including choropleth (area coloring), point markers, mini charts, labeled routes, and geo‑coordinate‑based connections. Each map element — area, point, or line — can be individually formatted and selected to present KPIs with precision and clarity.
Maps supports intuitive interactions like zooming, panning, rotating, and drilling, with features like auto‑centering and multiple geographic projections to enhance usability. With extensive formatting options and full offline functionality, Maps is your go‑to solution for geographic data storytelling in Power BI.





Further information
